About Me

Portfolio
Sales Analysis- Interactive Dashboard
Objective: Provide deep insights into sales data through comprehensive data modeling and interactive dashboards.
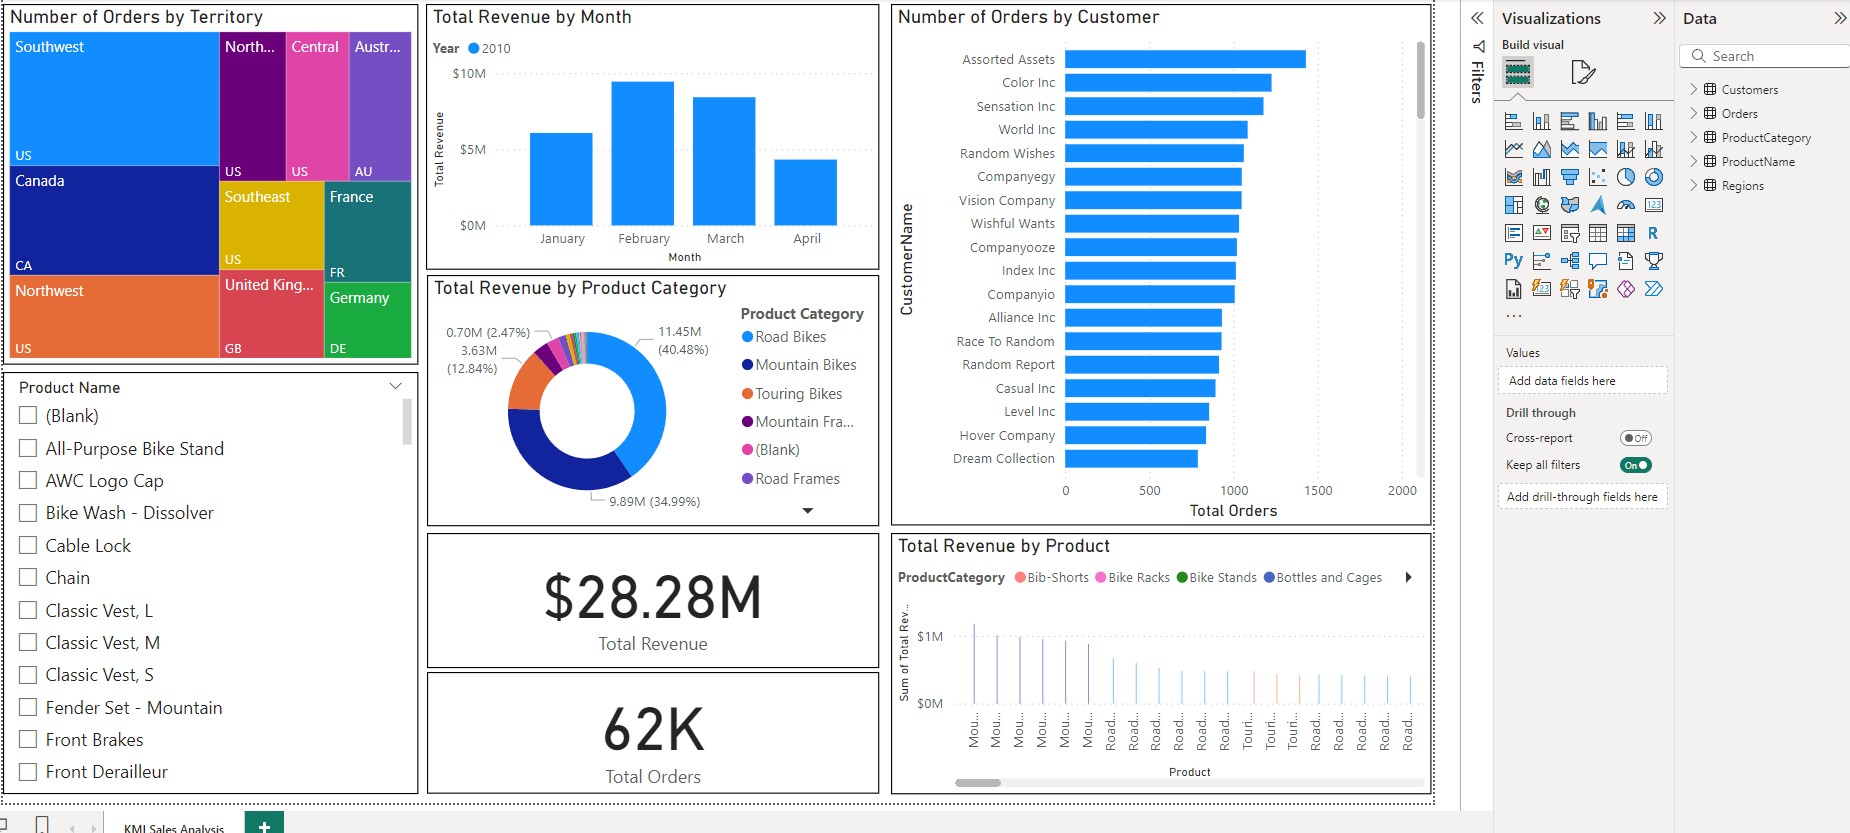
- Data Modeling: Designed an extensive data model to facilitate analytical queries and reporting.
- Interactive Dashboards: Developed detailed Power BI interactive dashboards to visualize sales trends and performance metrics.
- Actionable Insights: Derived strategic insights that support business decision-making processes.
Survey Breakdown Project
Objective: Analyzed survey data to uncover patterns and provide actionable insights, focusing on trends and key performance indicators.
- Data Cleaning: Processed raw survey data to standardize formats, remove inconsistencies, and prepare for analysis.
- Key Insights Identification: Identified patterns in survey responses, highlighting areas for improvement in user satisfaction.
- Advanced Visualization: Designed interactive Power BI dashboards, enabling real-time filtering and in-depth exploration of survey metrics.
- Actionable Outcomes: Provided data-driven recommendations to improve survey structure and increase engagement.
- Custom Metrics: Developed custom KPIs to measure success, including response rate trends, satisfaction scores, and demographic breakdowns.
Database Analysis Project
Objective: Developed a database project involving schema design, relational diagrams, and comprehensive queries to analyze and manage client-consultant relationships and contract data.
- Schema Design: Created a 3NF-compliant schema with the following tables:
- Region: Tracks location and regional associations.
- Contract: Stores contract details, including status and difficulty.
- Client: Manages client-specific data such as personal details and location.
- Consultant: Tracks consultant details, expertise, and assignments.
- Cross-Referencing: Includes ContractConsultant, Class, and ClassConsultant tables.
- Query Development: Designed 10 optimized SQL queries, including:
- Identifying client-consultant relationships by region.
- Tracking active contracts and filtering by difficulty levels.
- Displaying client and contract details for performance analysis.
- Relational Diagram: Visualized database relationships through an ERD and relational schema for seamless data flow.
Sales Analysis Project
Objective: Analyze car sales data to uncover trends, performance metrics, and revenue opportunities.
- Built Dashboards: Developed interactive Power BI dashboards to visualize sales performance and identify key trends.
- Data Analysis: Analyzed factors such as geography, seasonality, and pricing to uncover sales insights.
- Actionable Insights: Provided recommendations for optimizing sales and driving revenue growth.
Certifications
Foundations of Business Intelligence, Coursera, October 2024
Google Ads Measurement Certification, Google Skillshop, November 2024
Google Ads Search Certification, Google Skillshop, November 2024
Advanced SQL for Data Scientists, LinkedIn Learning, August 2020
SQL: Data Reporting and Analysis, LinkedIn Learning, June 2020
Bachelor’s Degree Certificate

Bachelor of Science in Information Systems
Graduated March 2021